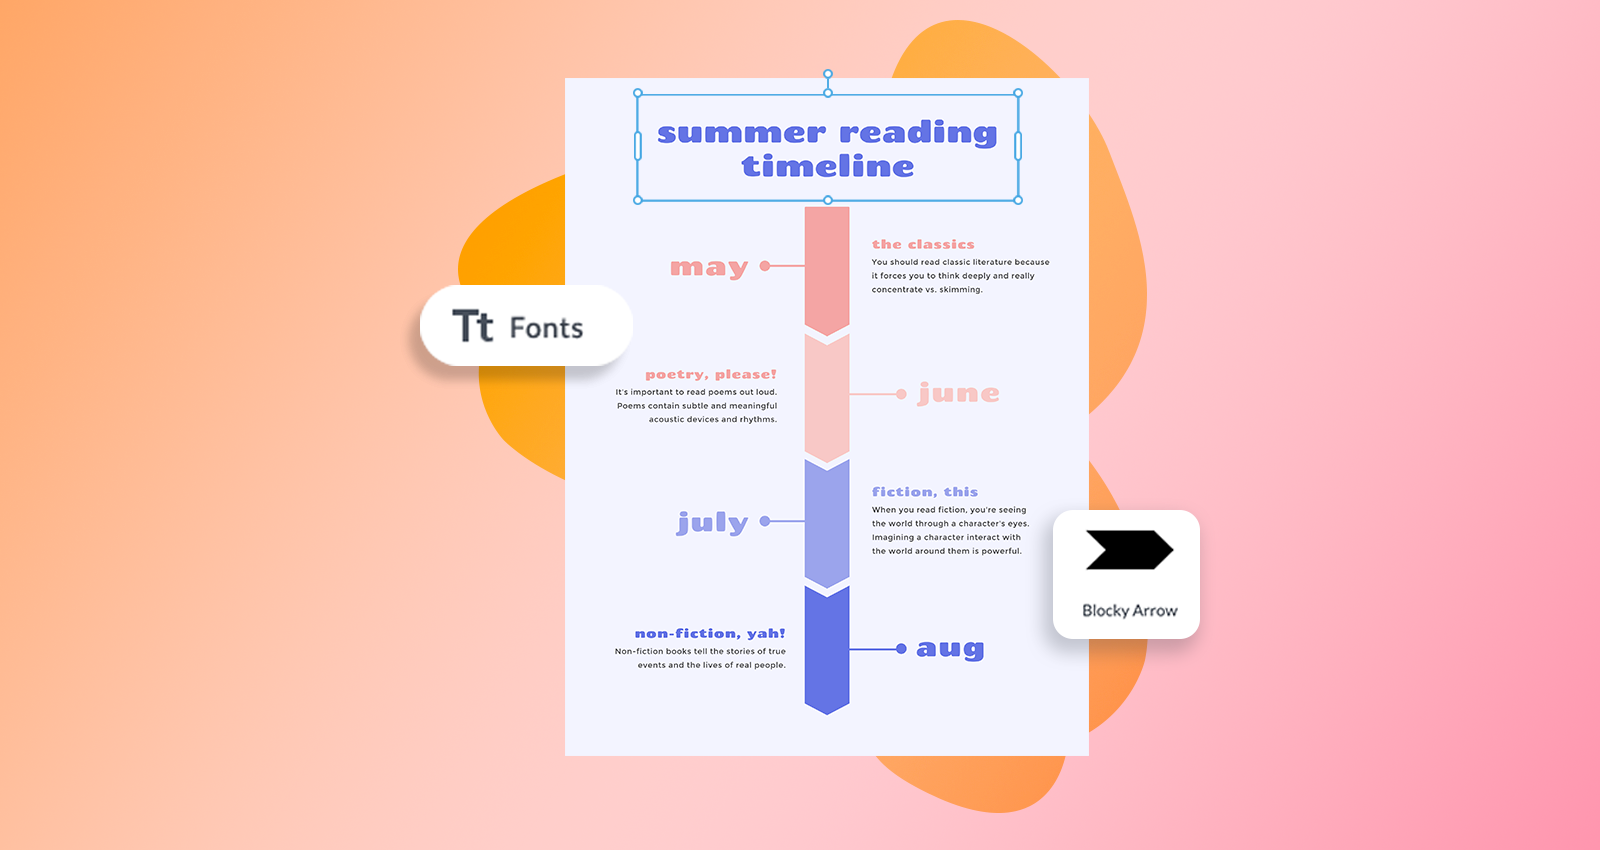
Let's talk flow charts. Flow charts display vital steps in a process that lead to a particular outcome. You might be familiar with the ever-popular Cosmo Girl quizzes that assure you whether or not you've found the one.
Or, maybe you make (or take) a quiz called, Which Type of Procrastinator Are You? which leads the audience to three options: A. The 11th Hour Person, B. The Quiet Delayer, or C. The Pervasive Procrastinator.
Maybe you know that flow charts work well in the sales industry to help train people on marketing pitches. In education? Flow charts are perfect for teaching and retaining info.
No matter your use for them, flow charts are integral in the learning process. Today, we're chatting all things flow charts and how to make your own in PicMonkey.
Let's rock it out.
What is a flow chart?
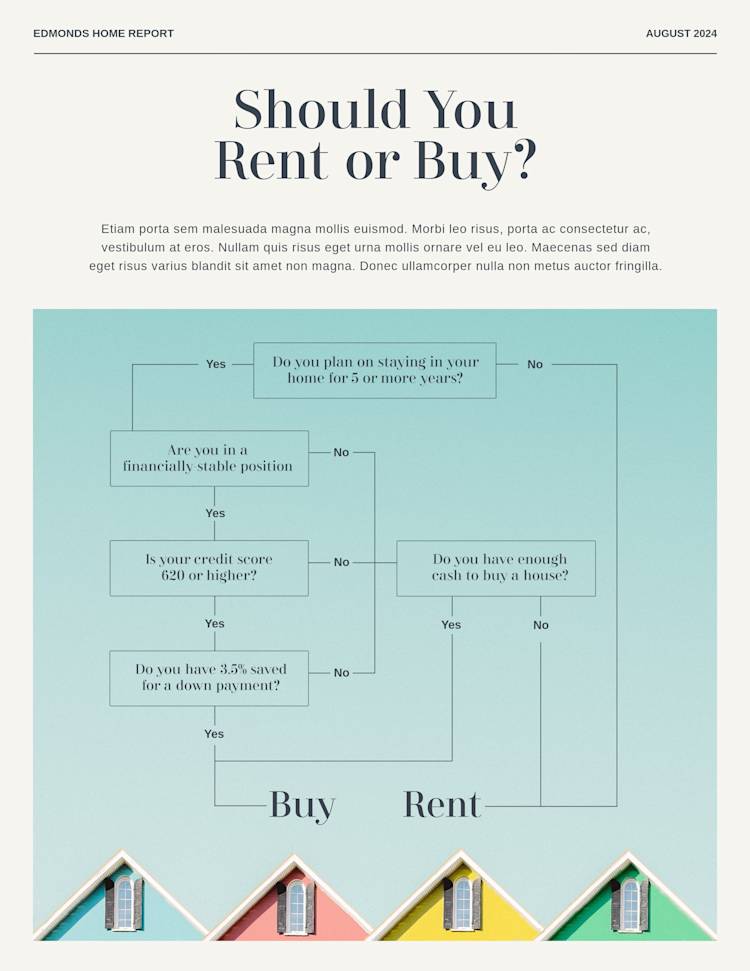
Feelin' the flow? Customize this flow chart template in PicMonkey!
Flow charts are diagrams that demonstrate a process, system, or sequence of functions. Flow charts make complex processes simple with drawn-out diagrams.
For example, if you were to make a flow chart of your morning routine, what would that look like? One step leads to another until you’re dressed and ready for the day. Whether you use flow charts at home, for work, or at school, they can be used to:
Designate roles in a particular environment
Study materials or teach principles
Explain a sales pitch
Demonstrate a company’s order of operations
Help you make the right decisions
Consider multiple outcomes in a process
Flow charts also have many names. They're often referred to as:
Business process models
Process flow charts
Process maps
Process flow diagrams
Process models
Functional process charts
Workflow diagrams
Functional flow charts
Business flow diagrams
Whatever you call them depends on your use for them. Unlike infographics (a design that's equal parts information and graphic), or conventional to-do lists, flow charts, well, flow. They create easy-to-follow instructions for their audience.
Of course, flow charts aren't limited to those in a particular industry or profession. They have plenty 'o personal uses as well, even if that means just simplifying the labyrinth of your mind.
Originally, flow charts were used for industrial engineers, which is why they still work well for developing computer programs and managing algorithms. However, their functionality has diversified to meet the sales, education, and creative worlds alike.
Flow chart uses by field
To map this out a bit, let's peek at the various uses for flow charts by field.
In education, flow charts are used to:
Plan coursework
Create lesson plans and presentations
Describe scientific processes
Measure hypotheses
Describe anatomical processes
In sales and marketing, flow charts are used to:
Plot survey flows
Chart sales pitches and processes
Plan marketing and research strategies
In business, flow charts are used to:
Illustrate procurement processes
Develop business plans
Document processes in preparation for an audit
Describe an employee’s daily duties
In manufacturing, flow charts are used to:
Show the inputs such as chemicals that go into product creation
Illustrate the manufacturing process to expose bottlenecks and inefficiencies
Quality control and assurance
Flow charts can be designed to match the exact field and intricacies you seek.
Flow chart shapes and symbols
Design-wise, flow charts use a range of shapes and symbols like rectangles, diamonds, ovals, and lines.
For a general rule of thumb, it may help to know that:
Shapes like circles or chevron-shaped symbols are referred to as connectors
Ovals also known as terminals are used to depict the beginning or end of a flow
Double-lined rectangles are used to depict a predefined process, sub-processes, and a marker for another process step
Convex hexagons are used to depict a modification to a process
Arrows are useful for showing a specific direction of the flow of information
You can find various types of lines from the Graphics tab. Simply type "line" into the search bar to find angled lines, basic lines, curved lines, and everything in between.
Pro Tip: Consider using icons instead of actual shapes or symbols. These also live within the Graphics tab. Simply type in a keyword to find what you seek.
Note that beyond function, shapes and (the order in which they're formatted) provide emotional context as well. Peruse our Graphics tab for an infinite list of shapes and symbols to keep your look consistent or contrasting.
Plus, peep this tutorial on color theory to examine which color combos can best suit your audience. So much of modern-day wellness thrives on the concept of mental wellness, which can be maintained with the right sensory experiences.
Calm colors like blue and violet can assist the learning and memory retention process. Once you discover which symbols and shapes suit you, you'll want to have some designated lines to use to connect them. Your design can be as simple or as complex as you want them to be, from hand-drawn on a napkin to digitally crafted and mapped.
Types of flow charts in PicMonkey
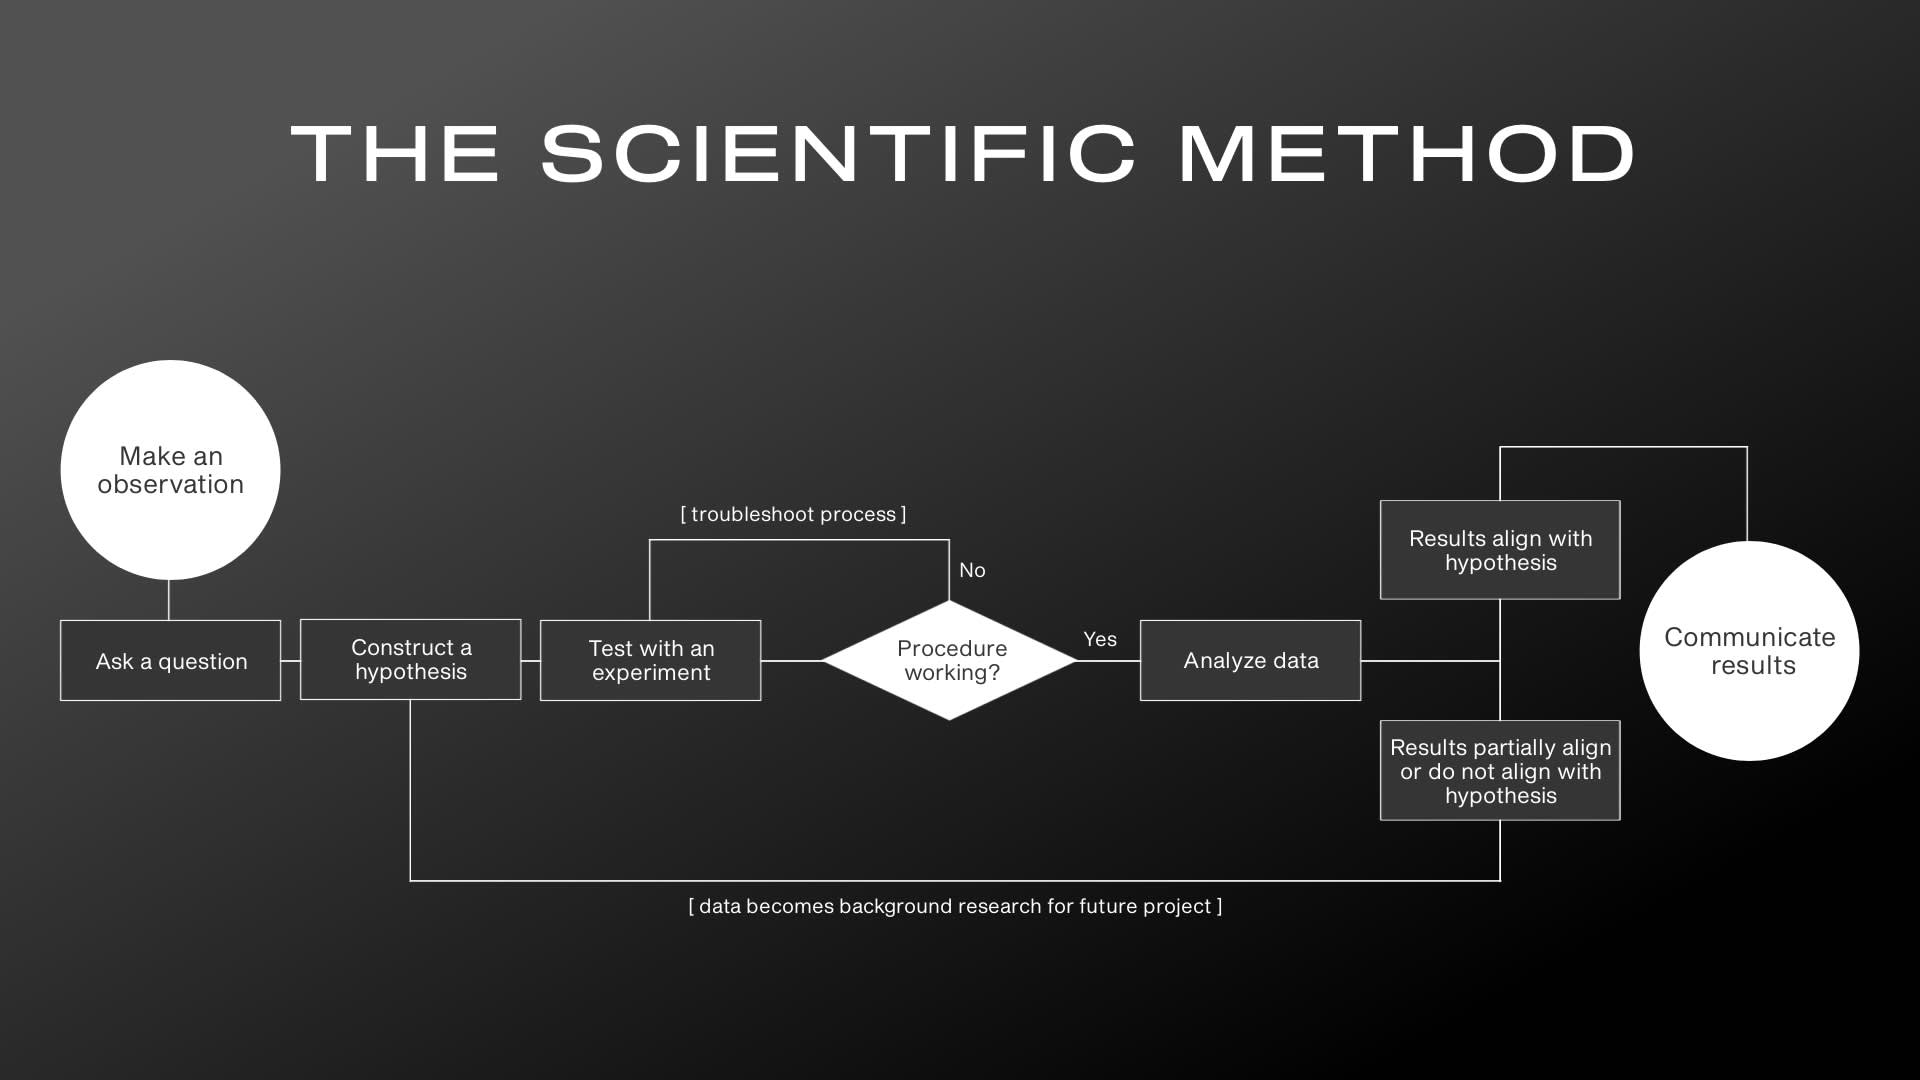
Feelin' the flow? Customize this flow chart template in PicMonkey.
While there are tens of types of flow charts out there in this big, wide, world, you can customize any type of flow chart template or blank canvas in PicMonkey to suit your needs.
And if you'd like a full tutorial on what some of those charts actually are, be sure to peep Types of Graphs and Charts Next. Now, while we love our blank canvases and empowering your creative visions, making lined graphs and charts on your own is a huuuuuge time-suck.
For that reason, we recommend going with the flow chart that most closely resembles what you need. And if you're up for the challenge to do your own thing, more power to ya.
Once you drop inside the tool by clicking File > Create new > Templates, you'll have all our templates made available to you.
Type "flow chart" into the search bar or scroll to find the category. Immediately, our templates will be split in two categories: Process Mapping or Other Flow Chart Templates. Simply click your favorite to customize.
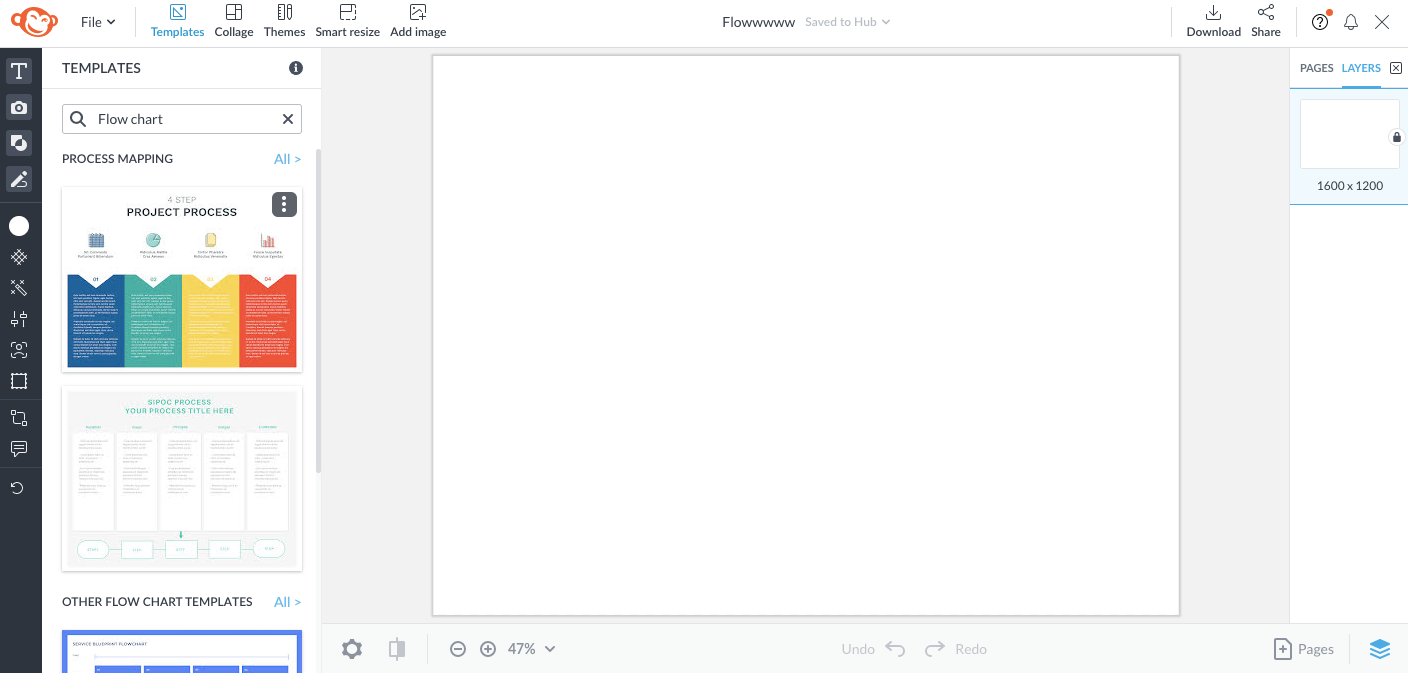
From here, customization may include:
Swapping or adding background images, textures, effects or brand colors.
Personalizing text with brand fonts or one of PicMonkey's hundreds of options.
Adding graphics from the Graphics tab.
All of these options live on the lefthand menu. Once you click the Text tab, the text editing toolbar will avail itself to you for Shadow & outline, Fade & blend, Animate, and so much else.
Simply take your time walking through each option, as you don't want to overdue your customization. Flow charts typically already have a lot of text on the page, so no need to get design-crazy with copious edits.
That's also why we love our artist-crafted templates so much, as you'll have much of the design ready to go (which is especially helpful for our less design-savvy folk).
Top 5 flow chart design ideas
Alright, flow chart folk! Before you give it a go, we've got just a few design ideas to leave you with.
1. Light texture
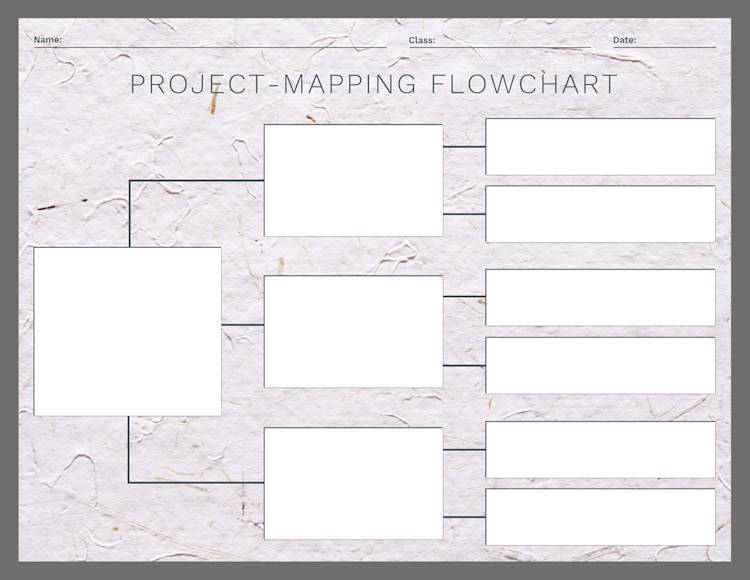
Feelin' the flow? Customize this flow chart template in PicMonkey!
Need to zhuzh up your design just a bit? Because let's face it—tasks can be boring (but they don't have to be!).
In PicMonkey, find that Textures tab and scroll to Paper. Note the Blend mode, as this will change the intensity of the texture. Again, be careful not to overdo the edits, especially if they make your text illegible.
If you start with a simpler template like this one, you have free range to do it up a bit more. We also edited the background layer by selecting it, clicking Change color, then choosing a solid.
Pairing solid colors with textures makes for a slick, contrasting look. If you want to go a step further, you can get as nuanced as changing the line and rectangle colors—totally up to you.
2. SIPOC layout
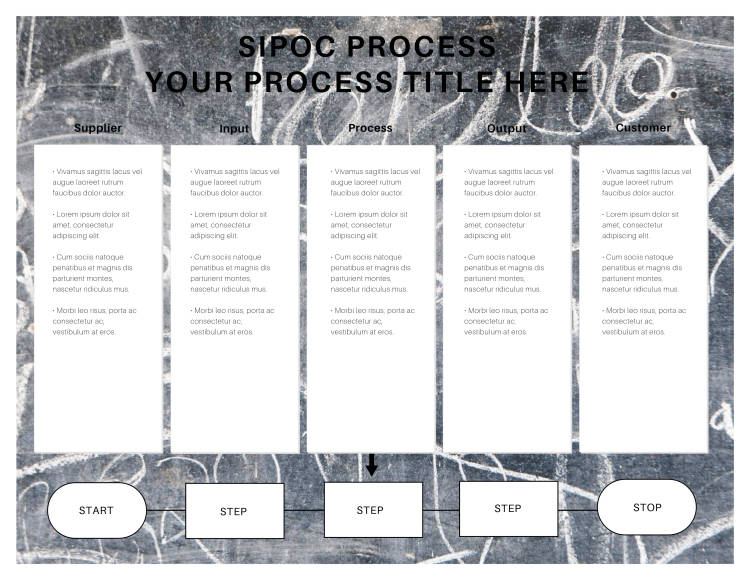
Feelin' the flow? Customize this flow chart template in PicMonkey.
SIPOC—Suppliers, Inputs, Process, Outputs, and Customers—is a specific yet unconventional type of flow chart.
We added a Boards texture to the background for this one—which also works wonders for the education community or DIY home-stayers who need to get organized.
3. Color gradient magic
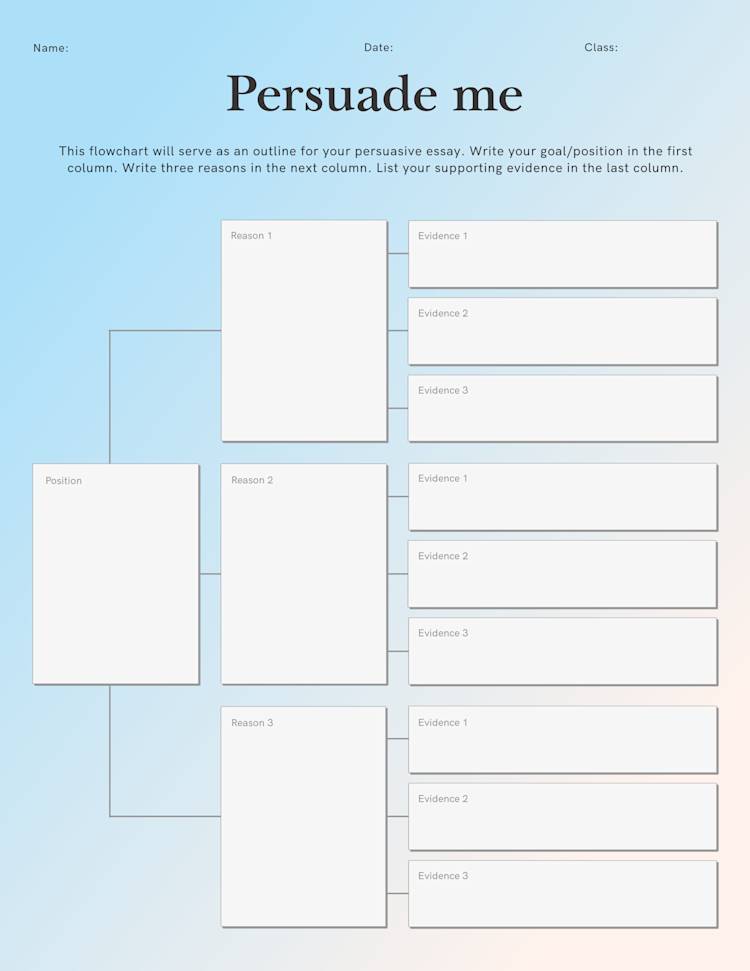
Feelin' the flow? Customize this flow chart template in PicMonkey!
Need a little pep in your flow chart's step? Highlight the background layer, then select the Background color circle button from the lefthand menu.
Choose among our solid and gradient options, or click + Add color from the Gradient tab to create a new tri-color blend. Note that you can also customize the direction of the colors on the canvas. Neat, eh?
4. Detailed accents
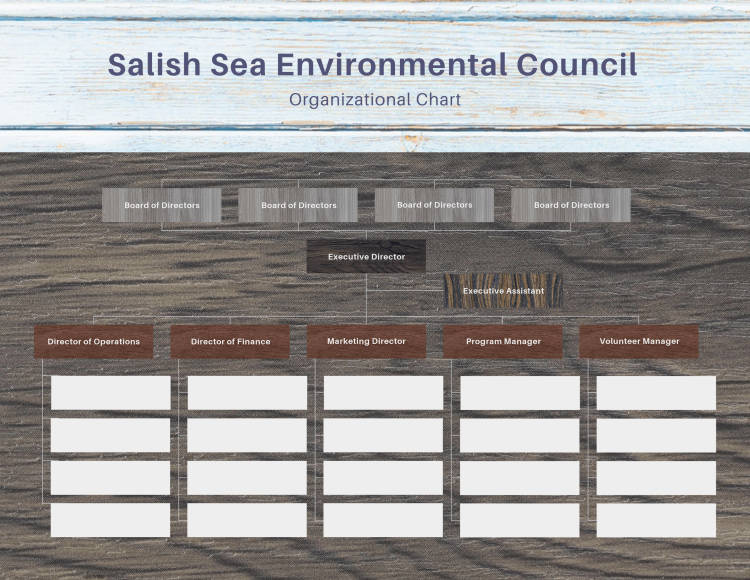
Feelin' the flow? Customize this flow chart template in PicMonkey!
All of the accents on this flow chart were crafted from the Wood texture (living in the Textures tab). Simply click on each asset to customize it. Remember, so long as you can read the text on top of the texture, you should be set.
Pro Tip: Customize your design to match your field, brand, or instruction. Don't be afraid to be nuanced. The intentionality won't be lost on your audience.
5. Directional textures
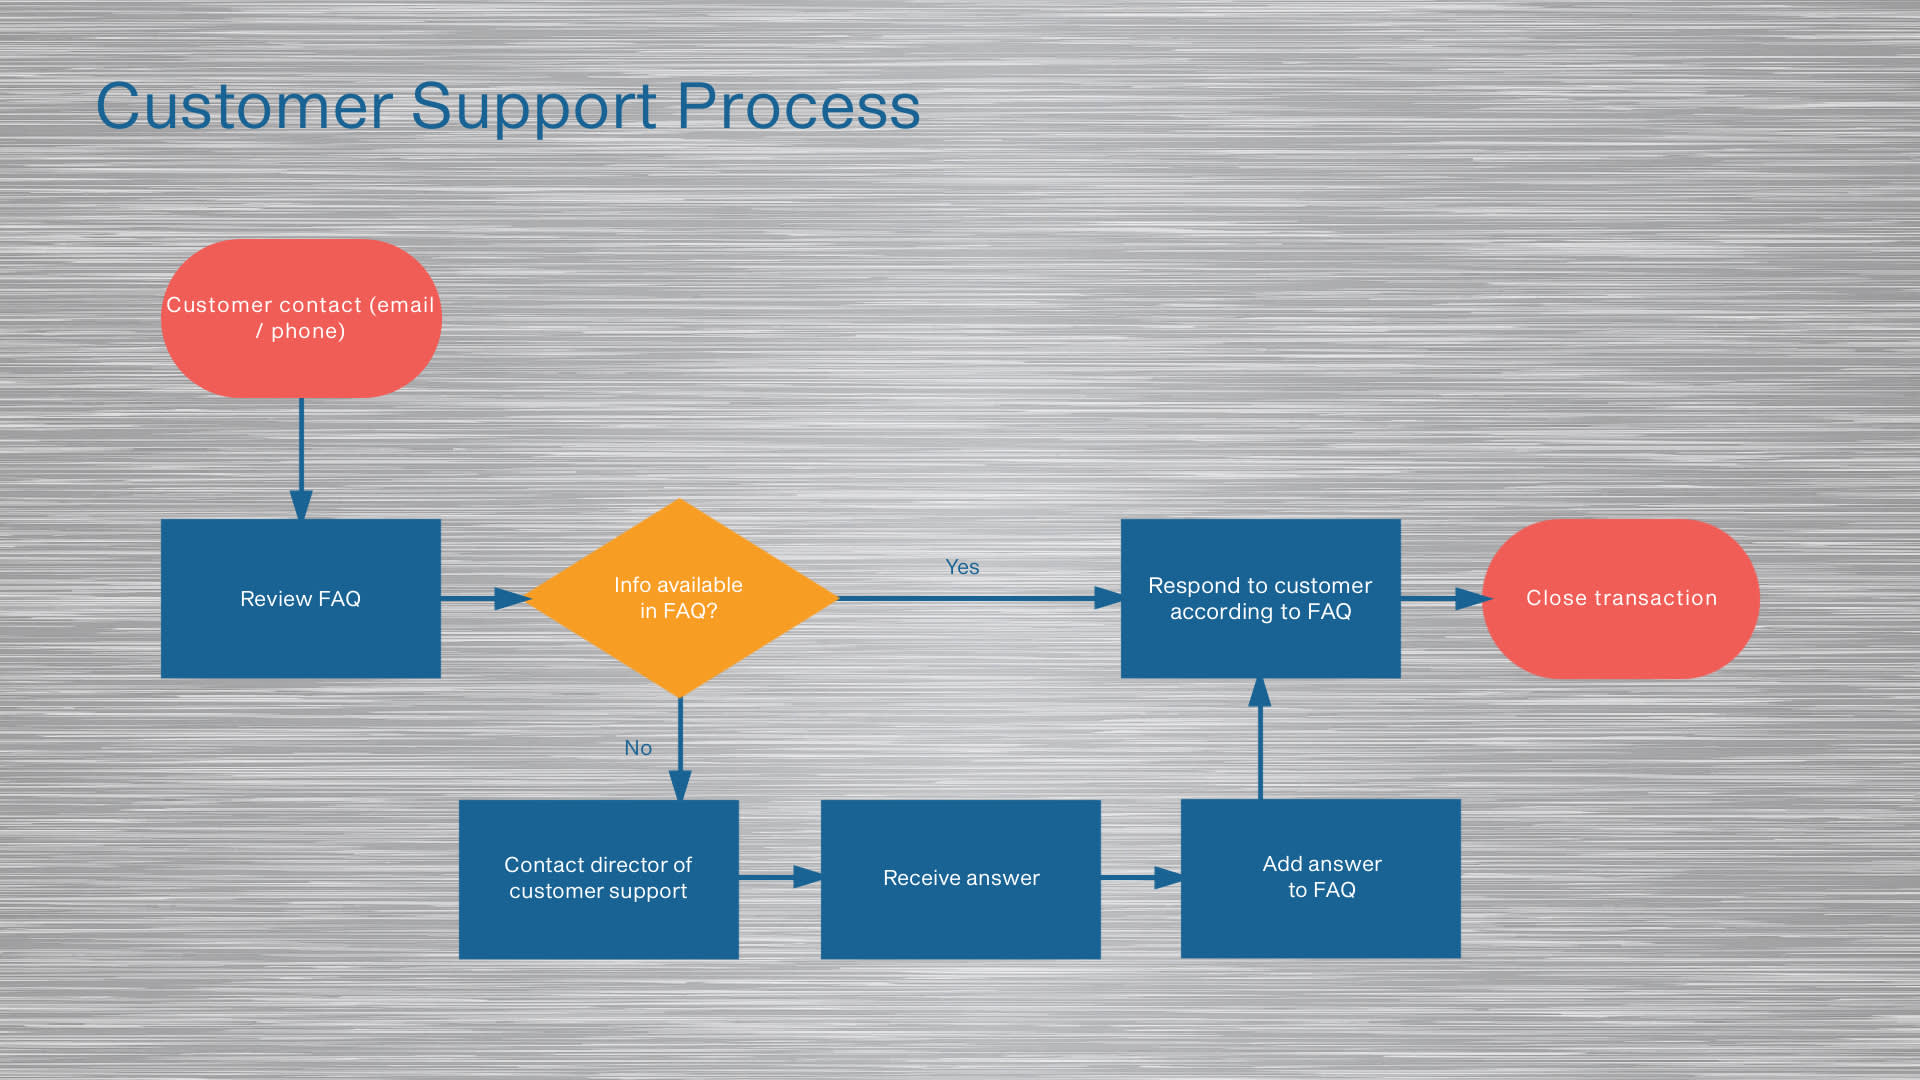
Feelin' this flow? Customize this flow chart template in PicMonkey!
Using textures that add a bit of movement can innately engage your audience better, faster, and longer. Add dimension to your design, add dimension to your message. Simple as that.
Last-minute quick tips for flow chart finesse

Feelin' the flow? Customize this flow chart template in PicMonkey.
Before you finish up your design concept, be sure to honor these quick tips to be in the ultimate flow with your flow chart.
Top nine flow chart musts
Keep your audience in mind. They're the most important informant of your design and its content.
Keep your workflow diagram as concise as possible. A flow chart beyond one page is a recipe for overwhelm. If it does go onto several pages, consider breaking it up into separate pages with on-page or off-page connectors.
Read the process chart out loud in order to identify redundant words or clunky sections.
Ensure the right image sizes. (Luckily, sizing within PicMonkey is insanely easy and comes with tons of image editing options. Plus, the templates are auto-sized to fix the right specs: 2550 x 3300 px.)
Ensure formatting for fonts and sizing is consistent. Also use a font that's visible and clean. Not sure which font pairs to use? Check out this tutorial for help.
Use colors strategically to highlight key elements. Colors are also useful in emphasizing certain steps in the process and to influence visual hierarchy.
Review your work for grammatical errors.
Add an eye-catching header to your process chart designs to make it stand out.
Add some animation to your flow chart if you’ll be sharing it online.
Top 4 flow chart considerations to avoid
Placing shapes too close together, making concepts difficult to follow.
Confusing phrases or fusing concepts together.
Blurring decision paths that aren’t easy to differentiate.
Using colors, fonts, or background elements that distract.
That's it! As you can see, there are infinite ways to use flow charts, fit for any field or function. The mantra, It does not matter how slow you go, so long as you don't stop may be helpful here.
Take your time to fill out each designated section so you can get really clear (for yourself and others) of your process. We're sure you'll learn a little something along the way.
Now hop into PicMonkey and give it a go! And be sure to show us how awesome you make it.
